Bowlsup Reports
BowlsLink does a good job of providing results and ladders but can only do so for 1 competition at a time. Navigating to the next competition can be tedious with a lot of clicking involved. This can be made a little easier by tagging competitions as favourites by clicking the star icon  when looking at any competition. Even so, it's still tedious. This is where Bowlsup Reports comes in. It allows you to view results and ladders for multiple competitions at once. It also provides this information in a better format as well as providing other reports not available in BowlsLink.
Descriptions of each of the reports available via Bowlsup follow. But first here are some conventions:
when looking at any competition. Even so, it's still tedious. This is where Bowlsup Reports comes in. It allows you to view results and ladders for multiple competitions at once. It also provides this information in a better format as well as providing other reports not available in BowlsLink.
Descriptions of each of the reports available via Bowlsup follow. But first here are some conventions:
-
Colour coding
-
Good values such as winning scores, points for and positive shot difference are shown in green.
-
Bad values such as losing scores, points against and negative shot difference are shown in red.
-
Neutral values such as drawn scores, number of draws and zero shot difference are shown in blue.
-
If a side is representing the club nominated as the club name to highlight it will be shown in bold fuchsia whenever that club name appears in a report.
-
Mouse over help
-
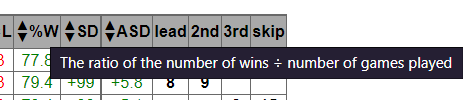
You can find out what a column heading means anywhere in Bowlsup Reports by holding the mouse over it. This also applies to anything with a dotted or dashed underline - putting the mouse over it will reveal something. On devices that don't have a mouse, putting the mouse over something can be simulated by placing a finger on it. Things that have a continuous underline generally comprise a link and are clickable.
-
Pointing triangles
-
► indicates that clicking on the entry will expand to show further content.
-
▼ indicates that clicking on the entry will compress the previously expanded content.
MCC fielded sides in the Saturday metro pennant competitions for 2021/22. MCC will be treated as the club name to highlight in the examples that follow.
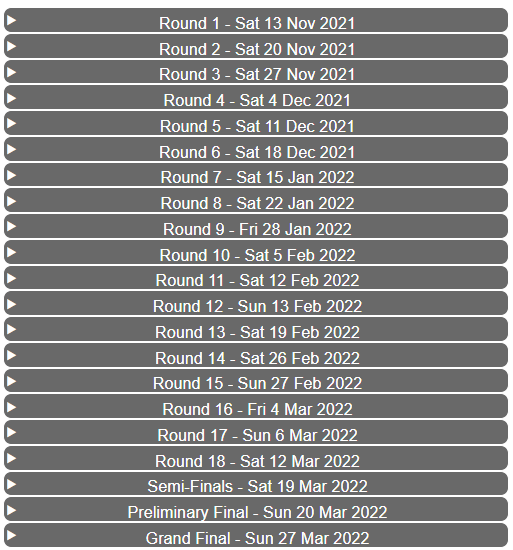
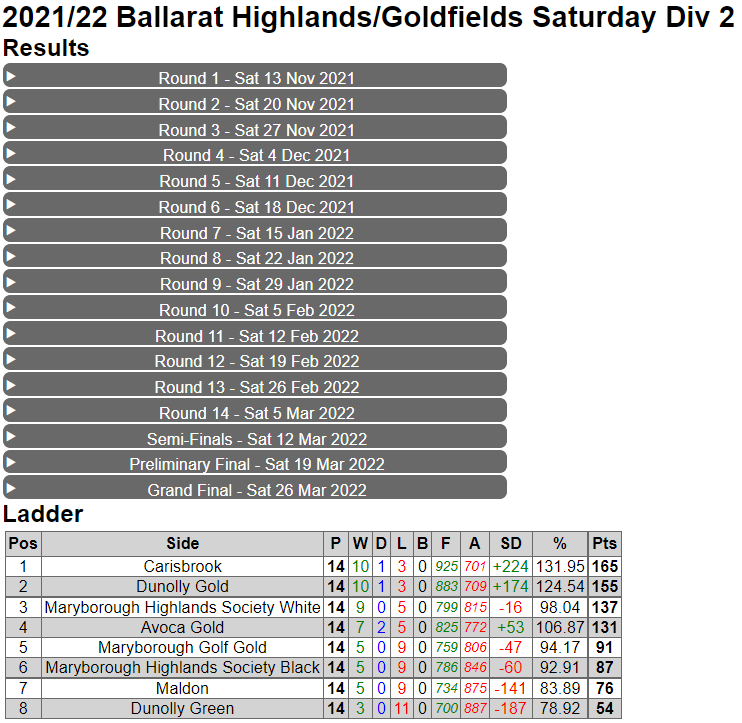
The results report for MCC's premier side is shown below. This is an improvement on BowlsLink's displaying of results in several ways.
-
all rounds are available at once - no more clicking to get to the round you want
-
all rounds of the sectional finals series matches are also immediately accessible
The results for each round are revealed by clicking on that round.
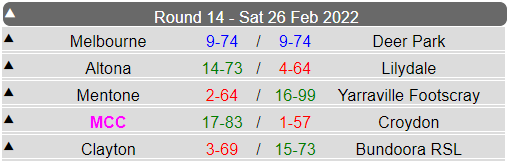
There are a few differences compared to a BowlsLink report of a result for a round - the
colour coding of scores and that MCC is highlighted. This is because MCC was nominated as the
club name to highlight.
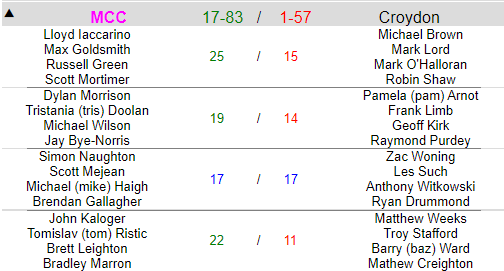
You can view the rink scores and players by just clicking on the match you're interested in to expand the item. This shows what becomes
visible after the drawn match between MCC and Croydon was clicked on.
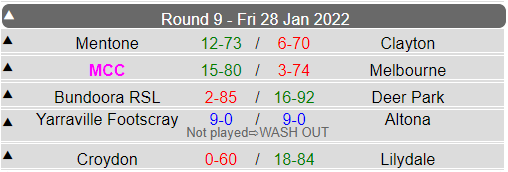
When a match is not played, the reason is shown below the result. For example, the round 9 match between Yarraville Footscray and
Altona was washed out.
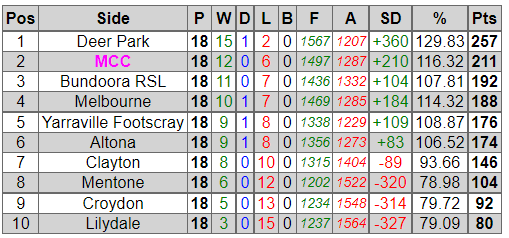
Apart from the
colour coding, a ladder shown in Bowlsup Reports will have exactly the same information in it as the one shown via BowlsLink .
A shortcoming with ladders shown in BowlsLink is that you can only see the ladder for the latest completed round. That is, if looking at this competition in BowlsLink, there is no way to view the ladder as it was for any of the previous rounds 1-17. Bowlsup Reports fixes this shortcoming with the
Ladder By Round report.
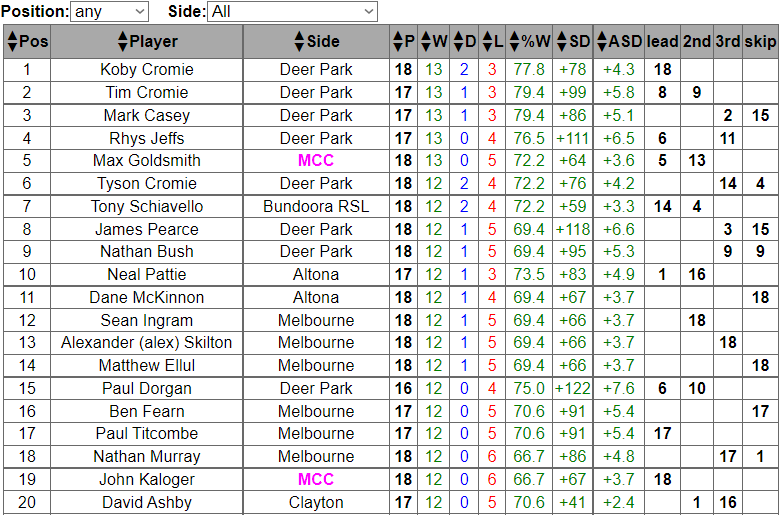
A Bowlsup Reports player ladder displays considerably more information than does one shown in BowlsLink. It also has much more functionality.
These are the extra columns:
-
%W
-
The winning percentage. In the above screenshot Koby Cromie was part of a winning rink 13 times which also had 3 draws out of 18 matches played giving a winning percentage of 77.8%. Holding the mouse over the column heading %W provides an explanation.
-
ASD
-
The average shot difference, being the shot difference divided by the number of matches played.
-
lead to skip - the number of times the player played in each of the positions. From the above screenshot you can see that Tim Cromie
was lead 8 times and played second 9 times. It would take a lot of clicking and collating in BowlsLink to elicit these details.
There are up and down arrow buttons (▲ and ▼) next to each of the 10 columns from
Pos to
ASD. Clicking on the up button (▲) sorts the data in that column upwards (meaning from smallest to largest for a number or in alphabetic order for text) with the down button (▼) causing sorting in the opposite direction.
The select boxes
Position and
Side positioned above the table are equivalent to Bowlslink's
Role Filter and
Competitor Filter, but with more meaningful labelling. For example, the screenshot below shows the skip ladder just for MCC players.
A point to note is that numbers in the
Pos column do not change when filtering occurs. Scott Mortiner may have had the best skipping rof the MCC players but was 5th when skips from -all- sides were considered. This ladder looks a little different when sorted by the winning percentage.
And is different again when sorted by the average shot difference.
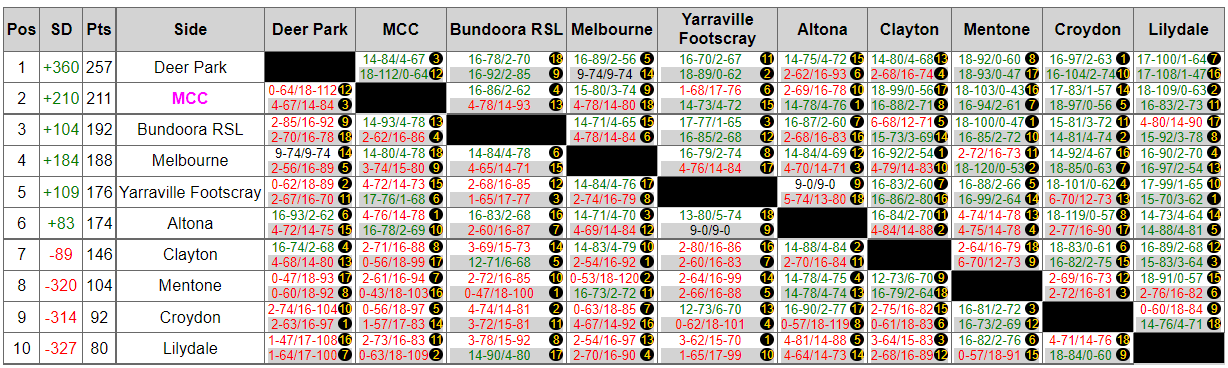
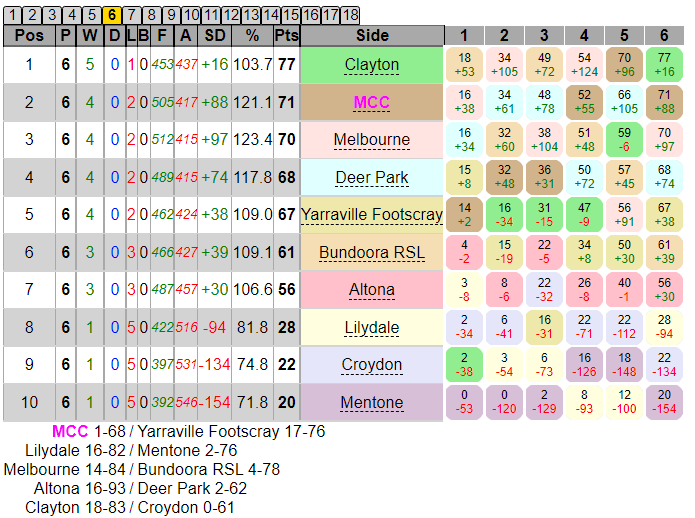
A ladder matrix displays the current ladder with all results and other fixture information in a tabular form. This allows
for a quick overview of the performance of all sides in the competition.
At this stage of the competition (after all home-and-away matches) Deer Park was on top.
The competing sides are shown in ladder order in the
Side column and as column headings in the top row of the matrix table.
The intersecting cells show the results when the sides meet with the result when playing at home shown with a white
background and with a grey background when away.
The first intersecting cell in the Deer Park row is black because the heading of the column is also Deer Park. The next intersecting cell
in the Deer Park row is for the results of matches when Deer Park played MCC. This shows that Deer Park won 14-84 to 4-67 when at home in round 3
(the number in yellow in a black circle) and also won away by 18-112 to 0-64 in round 12.
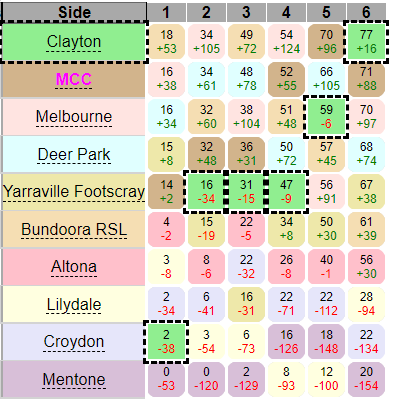
A ladder by round report shows the (calculated) unofficial* ladder for each round. This shows the ladder as it was after round 6.
The ladder for any round can be seen by clicking on the appropriate round tab above the table. The selected round is shown in the tabs
with a yellow background. The match results for that round are shown below the ladder.
Each side is shown with a different coloured background. The rounded boxes with matching coloured backgrounds shows the ladder position
with points and shot difference for this and each preceding round. Putting the mouse over the side name highlights the relevant boxes. Clayton has a light green background and you can see that Clayton was 9th after round 1 with 2 points and a shot difference of -38 and after 5 successive wins was on top after round 6.
Another good feature of the ladder by round is that it uses scores regardless of whether or not they've been confirmed by the opposing side^. This means it can be used as a live ladder before the official ladder is finally updated after all scores have been confirmed.
*
the ladder is unofficial because it is calculated based on accumulated unofficial match results. It assumes ladder positions are based firstly on
points then shot difference. It will only differ from the official BowlsLink ladder if the ladder positions are based on some
other method.
^
the process for entering scores in BowlsLink is that it is done by the home side. At this point the official result is only shown as "pending". The next step is for the away side to confirm the results as being correct. It is only when the away side confirms the result that it becomes official and that result is included in determining ladder positions.
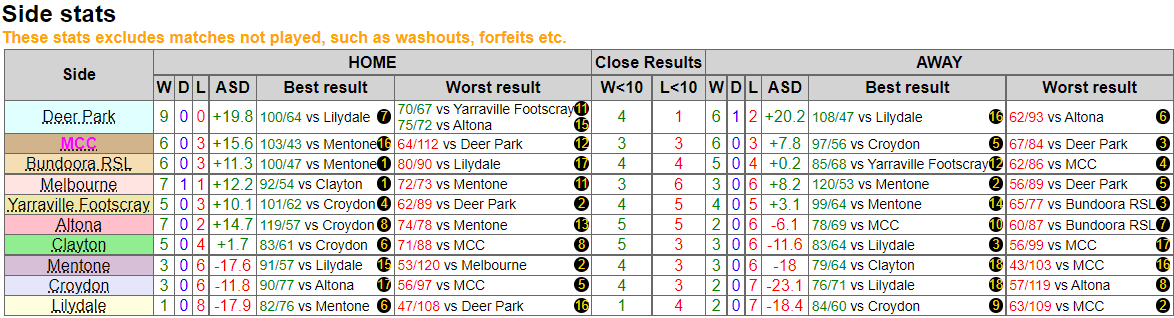
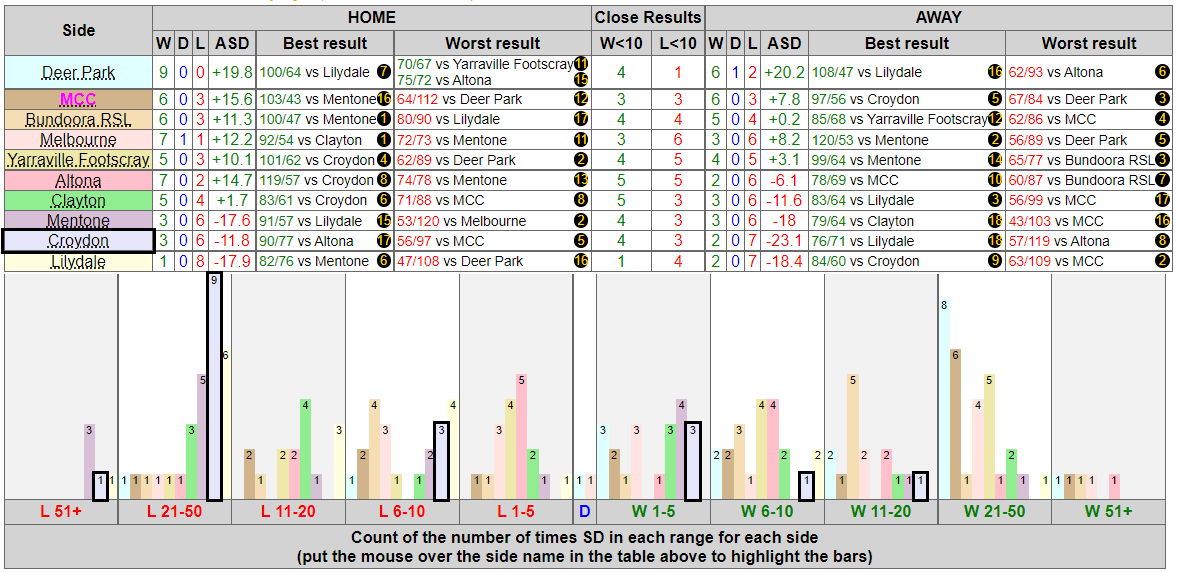
A side stats report lists various statistics of the peformance of each side when playing home and away.
The first thing to note is the advisory notice above the table. Statistics are only provided for games actually played. As noted in
results, the round 9 match between Yarraville-Footscray and Altona was washed out. This is why the total of wins, draws
and losses at home for Yarraville Footscray is 8 rather than the 9 for all other sides and the total of away results for Altona is also 8.
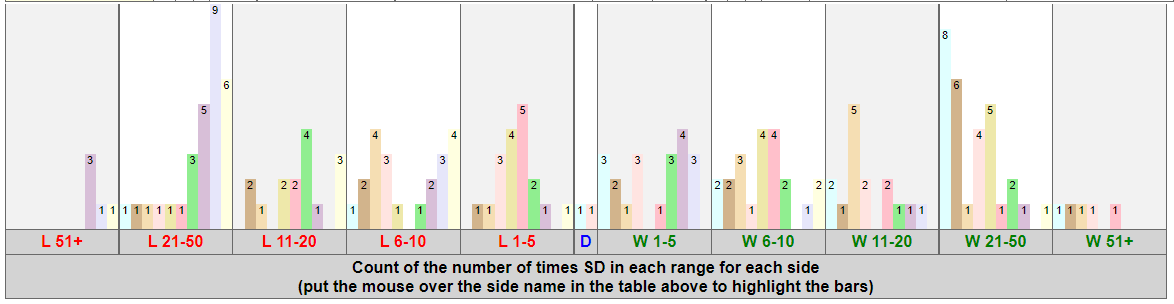
Below the table is a bar chart showing the number of times each side's results fell within certain ranges. From left to right (worst to best) the ranges are:
- lose by more than 50 shots (L 51+)
- lose by 21 to 50 shots (L 21-50)
- lose by 11 to 20 shots (L 11-20)
- lose by 6 to 10 shots (L 6-10)
- lose by 1 to 5 shots (L 1-5)
- draw (D)
- win by 1 to 5 shots (W 1-5)
- win by 6 to 10 shots (W 6-10)
- win by 11 to 20 shots (W 11-20)
- win by 21 to 50 shots (W 21-50)
- win by more than 50 shots (W 51+)
The colours of each bar match the background colours behind the side names. Each side will have the same background colour as it had in the
ladder by round report. When the mouse is placed over the side name in the table, the appropriate bars
in the bar chart are highlighted. The number at the top of each bar is the count of the number of times that result occurred. You can see in the
screenshot below that Croydon was the side that had 9 losses in the range 21 to 50 shots.
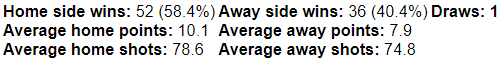
Below the bar charts is a summary of all matches played at home and away.
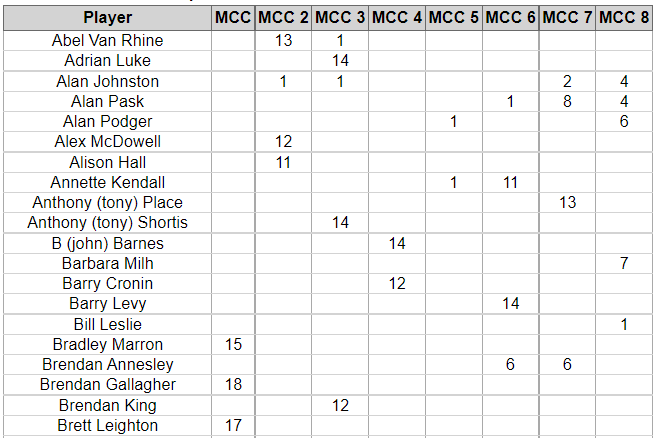
Conditions of play for pennant competitions typically contain rules regarding the eligibility to play finals and others that restrict
the interchanging of players between sides prior to finals. Complying with such rules can be tedious as it requires accurate and up-to-date
record-keeping by selectors. This report solves these problems by providing such data.
MCC had 8 sides in the 2021/22 Saturday metro pennant season. This is what such a report would look like after the completion
of all home-and-away matches. (To get this report you'd need to pick each of the competitions in which MCC had sides in the season.)
Determining eligibility for playing finals suddenly becomes easy. For Vic metro pennant, the restrictions on interchanging players
between sides applies for the last three rounds. Running this report at that time would also make compliance with this rule easy.
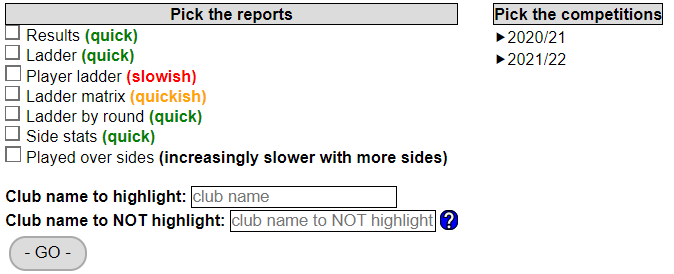
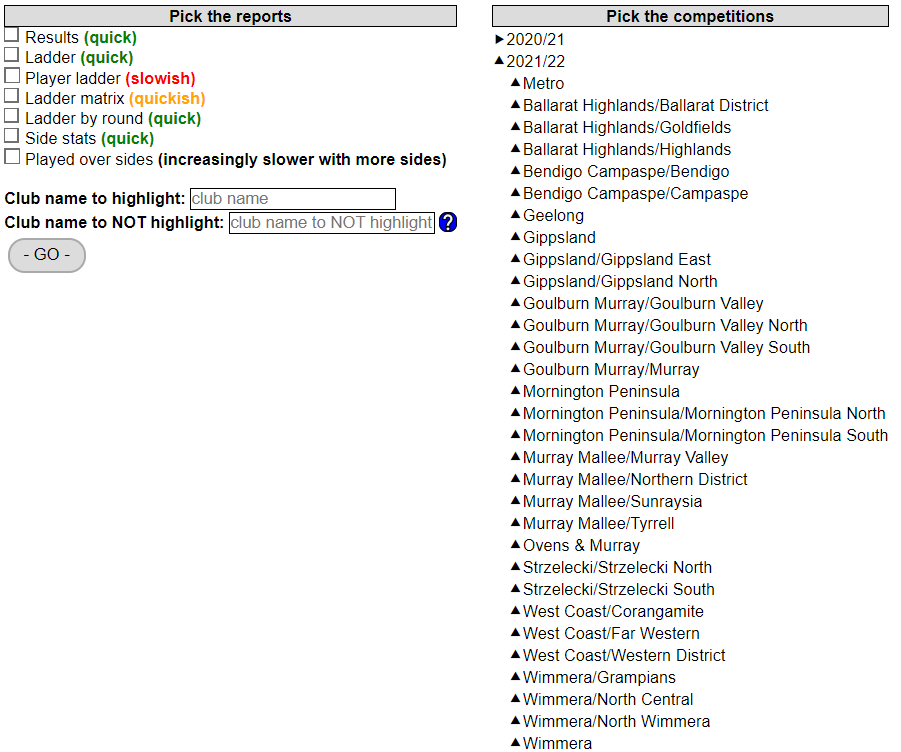
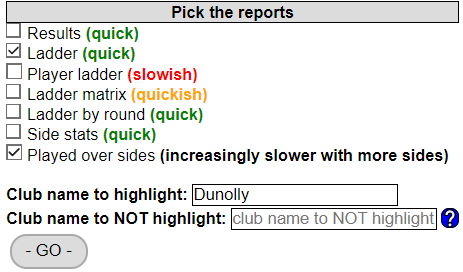
There are a few things you need to specify when using Bowlsup Reports. This shows the interface for the free demo version.
Each of the report types are described above. The comment in brackets next to each report type is an estimation of the relative speed in compiling that report. The total time taken will vary with the number of reports chosen and the number of competitions for which the reports are required. Having said that, the processing of the data obtained from BowlsLink is actually very quick; most of the time spent waiting for a Bowlsup Report is due to the time taken for BowlsLink to respond.
If a club name is entered in the
Club name to highlight:, the side name will be highlighted whenever the club name appears at the start of it. So nominating, say, MCC as the club name to highlight means MCC 1, MCC 2, MCC blue, MCC red etc. would be highlighted. There is also a way of preventing a side name being highlighted when the club name also appears in another club's name. An example would be if Bendigo was nominated as the club name to highlighted and there were competitions where both Bendigo and Bendigo East had sides then ordinarily both side names would be highlighted. This behaviour can be prevented by nominating Bendigo East as the
Club name to NOT highlight.
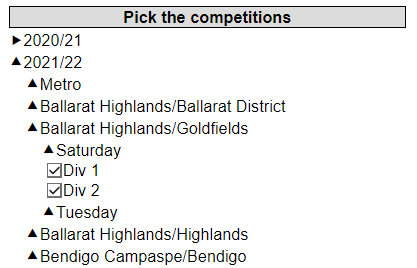
In the free demo version you have access to all pennant competitions in Vic Metro for the seasons 2020/21 and 2021/22 and for all pennant competitions in Regional Vic for the 2021/22 season. Clicking on the desired season reveals the region "playing areas" (this term may only apply in Vic).
The choice of pennant day follows and from there you get to pick the competition/s.
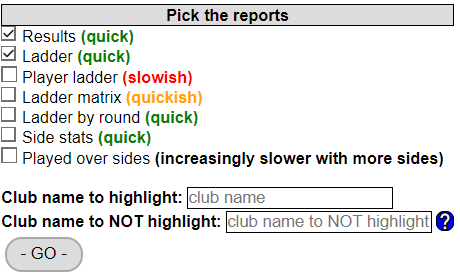
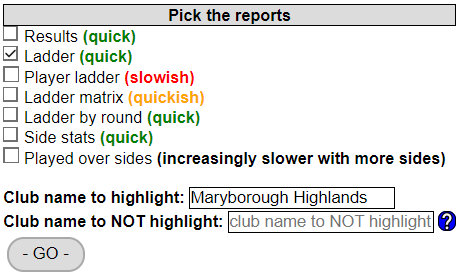
And the desired reports.
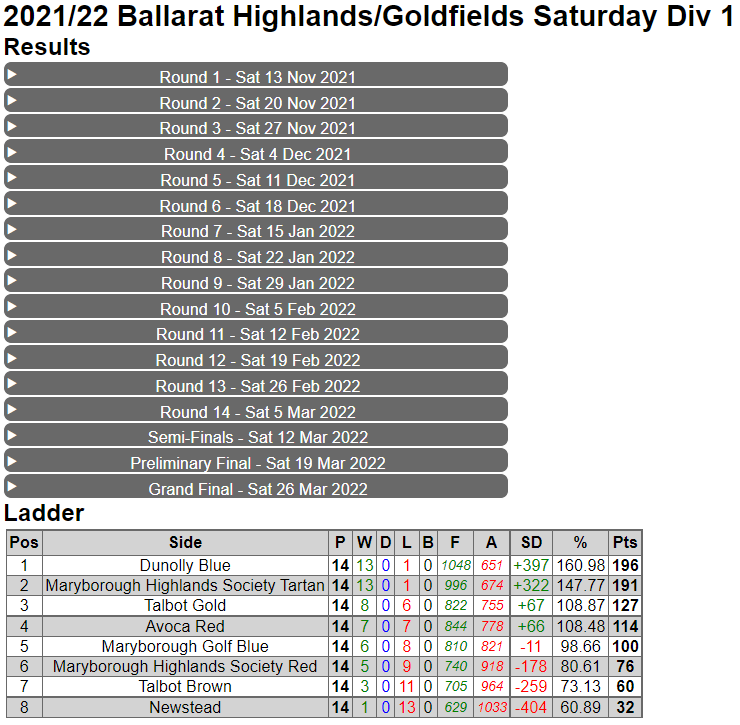
The competition name is then shown followed by each of the reports*.
And ......
The
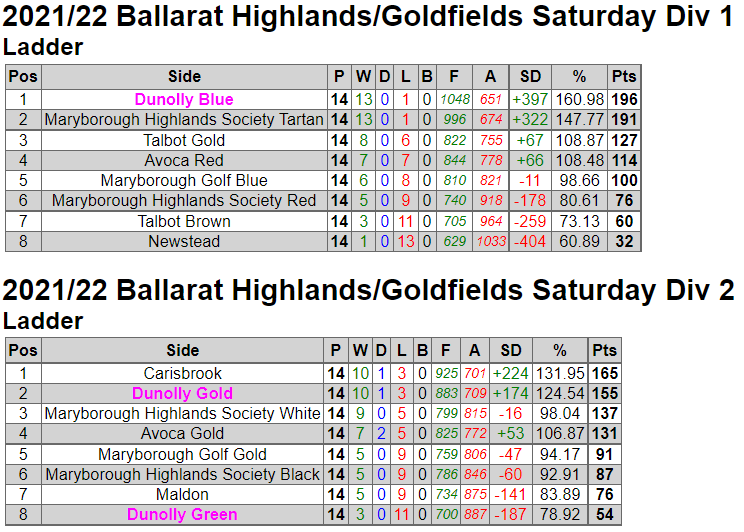
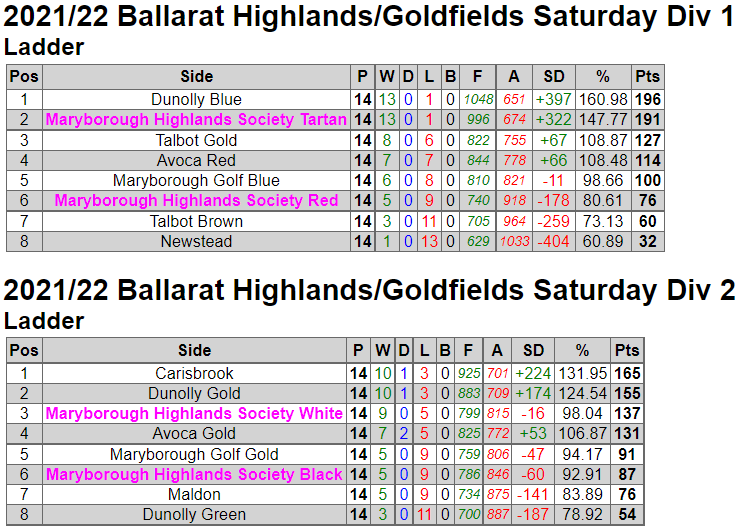
Club name to highlight: wasn't specified. When it is entered as "Dunolly" each of the sides with "Dunolly" at the beginning of their names are highlighted.
When
Club name to highlight: is entered as "Maryborough" each of the sides with "Maryborough" at the beginning of their names are highlighted, which may not be what you want.
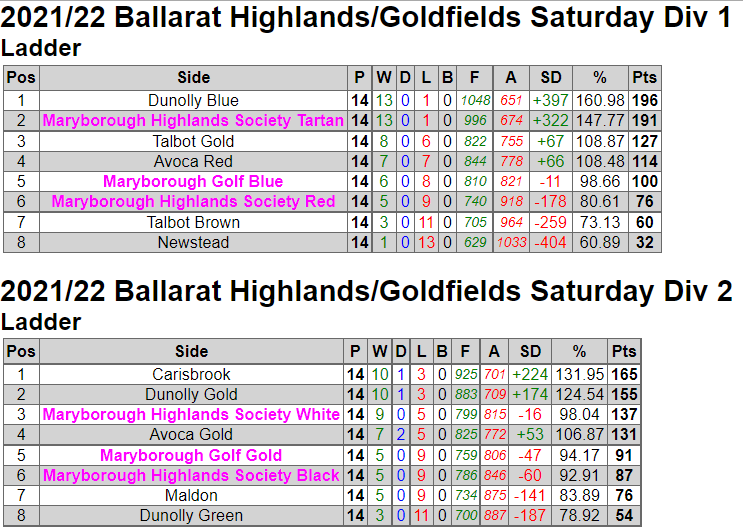
To restrict the highlighting to just, say, Maryborough Highlands Society, requires
Club name to highlight: to be more specific. "Maryborough Highlands" will do the trick.
*
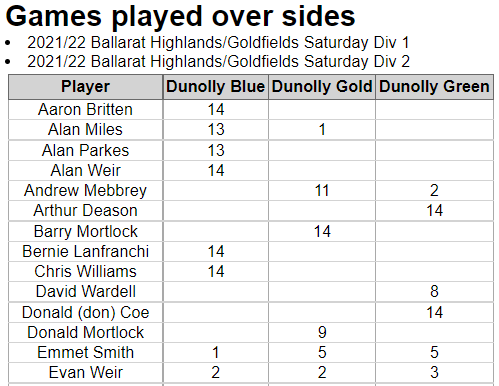
There is an exception to showing the competition name followed by each of the reports when the Played over sides report is chosen. In this case, this report will be shown first followed by the reports for each of the other competitions, if chosen.
Followed by ......